The China Copper Demand Index in September 2019 reached at 100.4, a rise of 14.2 points month-on-month. In September, the index hovered in the "normal" range (between 95.7-104.2), indicating that China market demand came back to normal in the month. China copper demand index reflects the current prosperity level of the copper end-use market. The absolute index values are presented in the form of month-on-month changes, the index indicates the prosperity level compared with the previous month.
Figure 1 China Copper Demand Index for Jan 2017 to September 2019
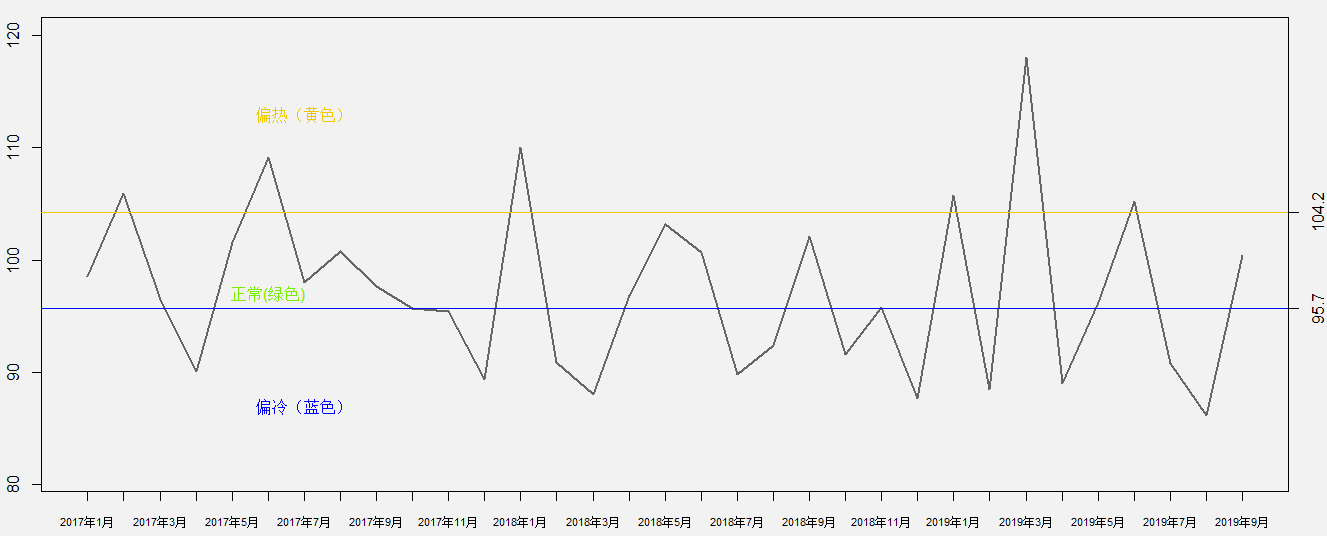
Source: China's National Bureau of Statistics and General Administration of Customs
China's copper demand in September 2019 stayed in the "normal" range, a rise from the copper demand in August 2019 though lower than that in September 2018. Data is regarded as the top contributor. After the seasonal adjustment, 52 macro indexes and end use industry indexes under the umbrella of this set of indexes all presented positive growth. Specifically, the completion rate for current capacity of new installations for water, coal, wind power generations and grid infrastructure development increased by 82%, 121%, 22% and 25%, respectively. Secondly, the sales volume of air-conditioners and solar water heaters increased by 18% and 38%. The fixed-asset investment in rail industry increased by 22%. 50% of all indexes presented positive growth, leading to the "rising" copper demand in China in September 2019.