
The China Copper Demand Index in June 2019 reached at 105.2 points, a rise of 9 points month-on-month. In June, the index wandered in the "heated" range (greater than 104.2 points), indicating a brisk demand for copper in China in the month. China copper demand index reflects the prosperity level of the copper end-use market. Because the absolute index values are presented in the form of month-on-month changes, the index compares the prosperity level with the previous month.
Figure 1 China Copper Demand Index for Jan 2017-June 2019
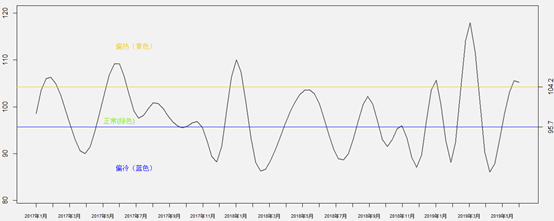
Data: China's National Bureau of Statistics and General Administration of Customs
In June 2019, China's copper demand remained "heated", higher on both month-on-month and year-on-year bases. A major contributor was the increasing statistic values. Among the 52 macro and copper end-use section indicators under the umbrella of this index after seasonal adjustments. The current new capacity of thermal power generating facilities, the current new capacity of wind power generating facilities, the cable and wire output, and the transformer output among other indicators all recorded double-digit growth, leading to a rise in copper demand in China in June 2019. In addition, half of the indicators posted positive growth in June 2019, while 35% of them reported negative growth in the same period last year, which boosted the year-on-year growth of copper demand in China in June 2019.
The China Copper Demand Index in May 2019 stood at 96.2 points, a rise of 7.2 points month-on-month. In May, the index wandered in the "regular" range (95.7-104.2 points), indicating a regular — neither gloomy nor heated — demand for copper this month.
Figure 1 China Copper Demand Indexes for Jan 2017-May 2019
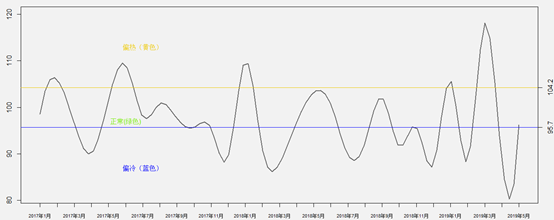
Data: China's National Bureau of Statistics and General Administration of Customs
China Copper Demand Index for May 2019 stayed in the "regular" range, higher than that for April 2019 yet lower than that for May 2018, with statistic pattern still regarded as a main reason. Among the 52 macro and copper end-use section indicators under the umbrella of this index after seasonal adjustments. The new capacity of wind power generating facilities, the cable and wire output and the gross sales of refrigerators all reported double-digit growth, leading to a rise in China's copper demand index in May 2019. In addition, 40% of the indicators enjoyed positive growth in May 2019, while 48% of them recorded positive growth in the same period last year, which caused the year-on-year decline of copper demand index in China in May 2019.
The China Copper Demand Index in April 2019 stood at 89 points, a drop of 29 points month-on-month. In April, the index stayed below the "gloomy" demarcation (95.7 points), indicating a gloomy demand for copper in China in the month.
Figure 1 China Copper Demand Indexes for Jan 2017-April 2019
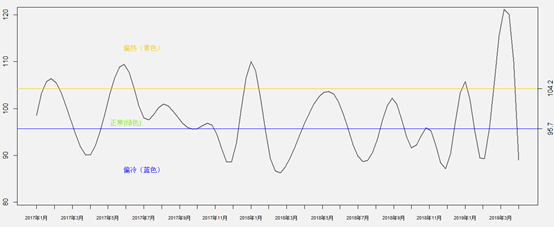
Data: China's National Bureau of Statistics and General Administration of Customs
A major contributor to the sluggish copper demand in China in April was statistical pattern. Among the 52 macro and copper end-use section indicators under the umbrella of this index after seasonal adjustments. The new capacity of power generating facilities: the wind power facility installations, the transformer output, and the sales value of heat pump water heaters among other indicators all recorded double-digit declines. Besides, 37% of indicators for April this year posted positive growth, against the 42% in the same period last year. The simultaneous declines, to varied degrees, in China's copper end-use indicators and macro indicators in April were major causes of the "gloomy" prosperity index in the month.
The China Copper Demand Index in March 2019 stood at 118 points, a rise of 29.5 points month-on-month. In March, the index wandered above the "heated" demarcation (104.2 points), indicating a brisk demand for copper in China in the month.
Figure 1 China Copper Demand Indexes for Jan 2017-March 2019
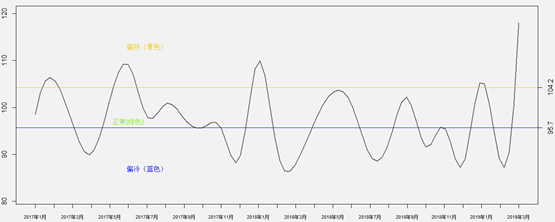
Data: China's National Bureau of Statistics and General Administration of Customs
There are two major reasons behind the strong demand for copper in China in March. First, after seasonal adjustments, nearly 75% of the 52 macro and copper end-use section indicators under the umbrella of this index posted positive growth month-on-month in March. Specifically, more than 10 copper end-use market indicators recorded double-digit growth, such as new capacity of wind power facilities, realized investment in power grid infrastructure construction, output of traditional cars, output of air conditioners and sales value of heat pump water heaters. On the other hand, only one-fourth of the 52 indicators achieved positive growth in the same period last year. The simultaneous growth to varied degrees of China copper end-use indicators and macro indicators in March was a major driver of the "heated" prosperity index in March. Second, some indicators only have the February aggregate figures available because of the index composition techniques, so the February aggregate figures have to be allocated to settle the current values for January and February in certain weighted proportion. In weight calculation, apart from statistical methods, the performance in the specific historical period also plays a part, which jointly leads to a smaller weight of the current data for February. The current values of most indicators for March, however, increased at a high rate, resulting in the surge of the prosperity index for March.