
The China Copper Demand Index in March 2019 stood at 118 points, a rise of 29.5 points month-on-month. In March, the index wandered above the "heated" demarcation (104.2 points), indicating a brisk demand for copper in China in the month.
Figure 1 China Copper Demand Indexes for Jan 2017-March 2019
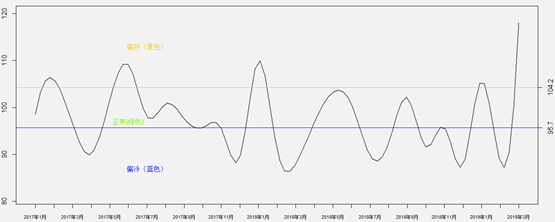
Data: China's National Bureau of Statistics and General Administration of Customs
There are two major reasons behind the strong demand for copper in China in March. First, after seasonal adjustments, nearly 75% of the 52 macro and copper end-use section indicators under the umbrella of this index posted positive growth month-on-month in March. Specifically, more than 10 copper end-use market indicators recorded double-digit growth, such as new capacity of wind power facilities, realized investment in power grid infrastructure construction, output of traditional cars, output of air conditioners and sales value of heat pump water heaters. On the other hand, only one-fourth of the 52 indicators achieved positive growth in the same period last year. The simultaneous growth to varied degrees of China copper end-use indicators and macro indicators in March was a major driver of the "heated" prosperity index in March. Second, some indicators only have the February aggregate figures available because of the index composition techniques, so the February aggregate figures have to be allocated to settle the current values for January and February in certain weighted proportion. In weight calculation, apart from statistical methods, the performance in the specific historical period also plays a part, which jointly leads to a smaller weight of the current data for February. The current values of most indicators for March, however, increased at a high rate, resulting in the surge of the prosperity index for March.