The China Copper Demand Index in May 2019 stood at 96.2 points, a rise of 7.2 points month-on-month. In May, the index wandered in the "regular" range (95.7-104.2 points), indicating a regular — neither gloomy nor heated — demand for copper this month.
Figure 1 China Copper Demand Indexes for Jan 2017-May 2019
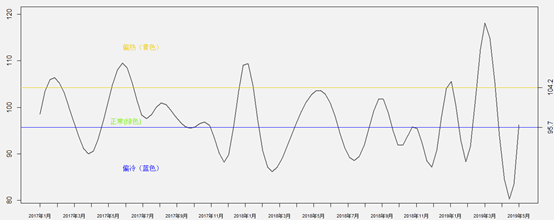
Data: China's National Bureau of Statistics and General Administration of Customs
China Copper Demand Index for May 2019 stayed in the "regular" range, higher than that for April 2019 yet lower than that for May 2018, with statistic pattern still regarded as a main reason. Among the 52 macro and copper end-use section indicators under the umbrella of this index after seasonal adjustments. The new capacity of wind power generating facilities, the cable and wire output and the gross sales of refrigerators all reported double-digit growth, leading to a rise in China's copper demand index in May 2019. In addition, 40% of the indicators enjoyed positive growth in May 2019, while 48% of them recorded positive growth in the same period last year, which caused the year-on-year decline of copper demand index in China in May 2019.