
The China Copper Demand Index in July 2019 stood at 90.8 points, a drop of 14.4 points month-on-month. In July, the index hovered in the "cooled" range (smaller than 95.7 points), indicating that China market presented a cooled demand for copper in the month. China copper demand index reflects the current prosperity level of the copper end-use market. Because the absolute index values are presented in the form of month-on-month changes, the index indicates the prosperity level compared with the previous month.
Figure 1 China Copper Demand Index for Jan 2017 to Jul 2019
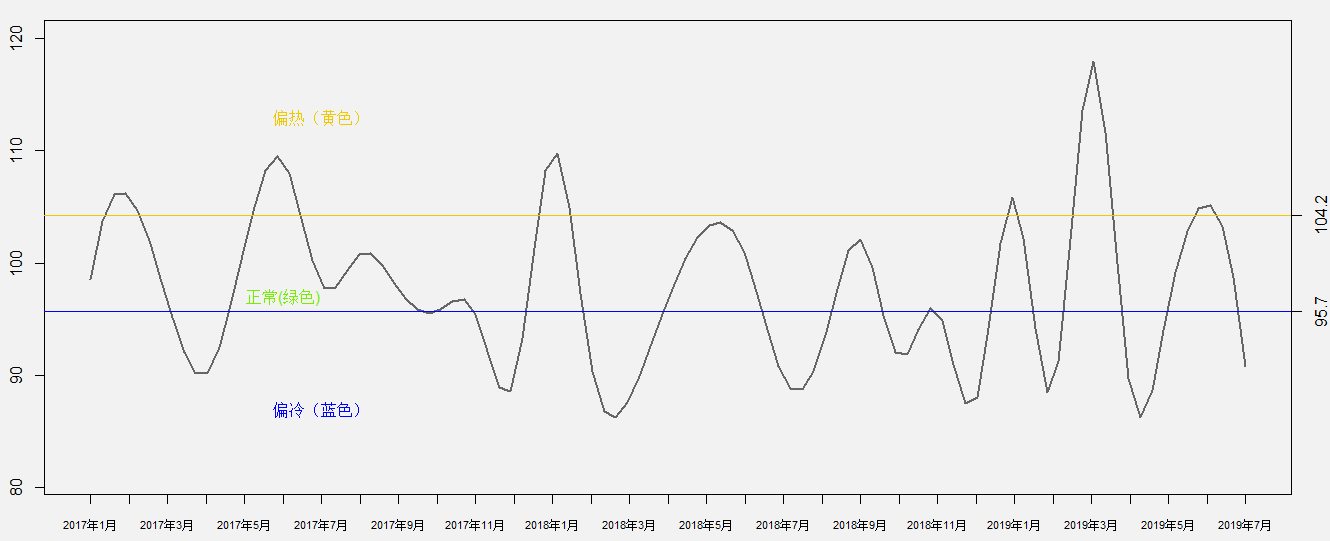
Source: China's National Bureau of Statistics and General Administration of Customs
China's copper demand in July 2019 stayed in the "cooled" range, under-performing the copper demand in June 2019 and running flat with that in July 2018. Data is regarded as the top contributor. After the seasonal adjustment, 42% of the 52 macro indexes and end use industry indexes under the umbrella of this set of indexes suffered negative growth. Specifically, the current capacity of new installations for thermal power generation and the current capacity of new installations for wind power generation declined by 54% and 46%, respectively. Second, macro data, such as the current value of completed fixed-asset investment in secondary industries, also went downward, leading to the "cooled" copper demand in China in July 2019.