
The China Copper Demand Index in August 2019 stood at 86.2, a drop of 4.6 points month-on-month. In August, the index hovered in the "cooled" range (smaller than 95.7 points), indicating that China market presented a cooled demand for copper in the month. China copper demand index reflects the current prosperity level of the copper end-use market. The absolute index values are presented in the form of month-on-month changes, the index indicates the prosperity level compared with the previous month.
Figure 1 China Copper Demand Index for Jan 2017 to Aug 2019
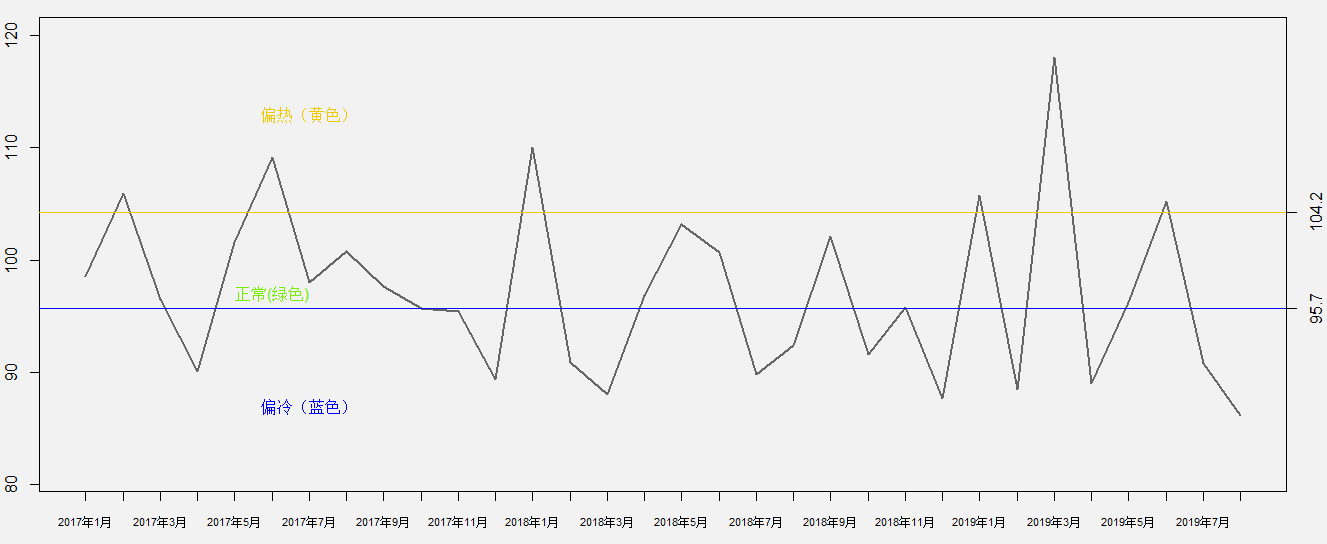
Source: China's National Bureau of Statistics and General Administration of Customs
China's copper demand in August 2019 stayed in the "cooled" range, under-performing the copper demand in July 2019 and lower than that in August 2018. Data is regarded as the top contributor. After the seasonal adjustment, 52 macro indexes and end use industry indexes under the umbrella of this set of indexes suffered negative growth. Specifically, the current capacity of new installations for water power generation and the completion rate of grid development declined by 64% and 13%, respectively. Secondly, the sales volume of heat pump water heater and rail fixed-asset investment also dropped by 15% and 16%. The last but not the least, the macro data, such as the current value of completed investment in secondary industries, also went downward, leading to the "cooled" copper demand in China in August 2019.